

How TMX Became The Global Gas Gatekeeper

Welcome to another issue of Front Month, a newsletter covering the biggest stories in exchanges every Friday. If you have questions or feedback, please reply to this email or find me on Twitter. If you like this newsletter and want to follow the exchange industry with me, please hit the Subscribe button below & be sure to share with friends & colleagues:
TMX - Canada’s Exchange Leader With The Keys To Europe’s Energy Market

(Trayport’s Joule energy trading screen - Source)
An opportune 2017 acquisition transformed TMX from Canada’s largest exchange into a global energy gatekeeper.
TMX Group has been Canada’s leading cash equities & futures exchange for years, with roots stretching back to the 1860s formation of the Toronto Stock Exchange. In 2015 TMX reorganized and began focusing on global expansion, joining the industry in diversifying away from its core transaction business and prioritizing recurring subscription revenue. At the time, TMX’s core products included cash equity trading, listings, a few large Canadian interest rate futures markets, and NGX - a North American power & natural gas exchange.
Enter ICE. The exchange giant had just lost a drawn out UK antitrust review of its purchase of Trayport, an energy data company, and was forced to sell. In late 2017 TMX and ICE agreed to an asset swap - ICE would receive NGX & £350 million in cash, and TMX would receive Trayport.
What TMX gave up in energy trading, it made up in valuable energy market data. European utilities markets (natural gas & power) are fragmented between a large network of brokers and public exchanges; Trayport provides one trading screen aggregating them all in one place. Reports show Trayport has ~89% penetration among Europe’s energy trading community, and a majority of all the regions’ utilities trading flows through its screen. The second largest European utilities market is ICE’s WebICE platform, with half the market penetration. Trayport’s lead is substantial, with formidable network effects and a closed system making it extremely sticky.
Until very recently, Trayport’s European dominance had limited global implications. Growth was expected to come from more regional electronic trading & improving network effects. Trayport and TMX got more than they bargained for when global natural gas markets started using Europe as its go-to benchmark:

(Source: Bloomberg, Reuters, Montel)
As I detailed in last week’s issue, the Dutch TTF natural gas market is now bigger than the US gas market. Trading volumes are soundly breaking records set last year, and growth doesn’t look to be slowing down soon. Since the TMX deal, subscribers to Trayport’s Joule trading screen are up over 20%:

Trayport accounts for ~15% of TMX’s total revenue and ~40% of their market data revenue, bringing in ~$90M USD per year and growing. Management has made it clear they’re focused on investing to grow Trayport and expand the screen’s reach - recent action includes signing up-and-coming US power exchange Nodal to the platform and buying VisoTech to improve their algorithmic trading capabilities.
TMX reported Q3 earnings on November 4, posting +6% revenue growth and +12% EPS growth driven in large part by - you guessed it - strong performance at Trayport. A UK antitrust decision helped TMX capitalize on a European energy surge, boosting results in 2020 and maybe for multiple years ahead.
Virtu - A Coiled Spring Exiting Q3

(Source)
The last three years have seen Virtu in integration mode after closing on two large acquisitions - Knight Capital in 2017 and ITG in 2018 - for a combined $2.5 billion. As the flurry of deals faded, COVID volatility came and gave Virtu plenty more to manage. The dust has begun to settle as we received Q3 earnings from the company on November 6. Virtu has extracted ~$480M in run-rate synergies from their combined acquisitions, and they’ve used the influx of cash flow from COVID volatility to pay down related debt. While market chaos has subsided from early 2020 levels, we’re still in a volatile period compared to historical averages, and Virtu has been able to capitalize:

Analyst questions on the earnings call centered on a core theme: what does a “normalized” Virtu look like now? Management responded with a few highlights worth noting:
Virtu’s COO said investors can expect ~$2 in annual EPS in “worst case” volatility environments. With the stock trading at ~$23.50 at time of writing, this implies Virtu is trading at ~12x “worst case” EPS.
Virtu committed to consistently return capital to shareholders in the form of dividends (the stock yields ~4% today) and buybacks. A new $100M buyback program was announced in conjunction with earnings, representing ~2% of shares outstanding.
Management also mentioned there are still macro catalysts playing in the company’s favor, not the least of which is the move to $0 brokerage commissions globally. While the discount brokerages (Robinhood, ETrade, etc) have already gone free, there are still many institutional brokerages that charge for trading in some fashion. Virtu predicted these firms will also lower fees over time, reducing barriers for even more volume to flow to the market maker.
Overall, I view Virtu as a coiled spring exiting 2020. The company’s balance sheet is as strong as it’s been since the KCG deal, and synergies give plenty of room for Virtu to extract value from routine volatility on a daily basis. There are medium & long term tailwinds for the company playing out, all with the embedded call option of spikes in volatility bringing excess returns. I’m long Virtu and am highly encouraged by Q3 earnings results and the go-forward outlook.
Investor Conferences
Executives from Nasdaq, CME and CBOE all gave public comments this week during their respective investor conferences, answering analyst questions & adding context to both current performance and their view of the future.
Nasdaq - When Adena Friedman became CEO towards the end of 2016, Nasdaq underwent a strategic pivot to focus resources on their Market Technology and analytics businesses. At the time, management gave a medium term target of mid to high single digit growth in their non-trading segments - a target they’ve largely achieved.
During their 2020 Investor Day on November 10, Nasdaq essentially doubled down on this pivot and embraced a SaaS model for their non-trading units. For Market Technology specifically, this means transitioning clients from 1x service contracts to multi-year, recurring agreements where Nasdaq can leverage one suite of software to serve the market at scale. The company argued that their multi-year pivot has positioned them to take a growing slice of huge addressable markets - particularly in Market Technology. Products that serve this market include financial anti-crime detection & prevention systems, compliance services, and core matching engine software exchanges can use to build new products:
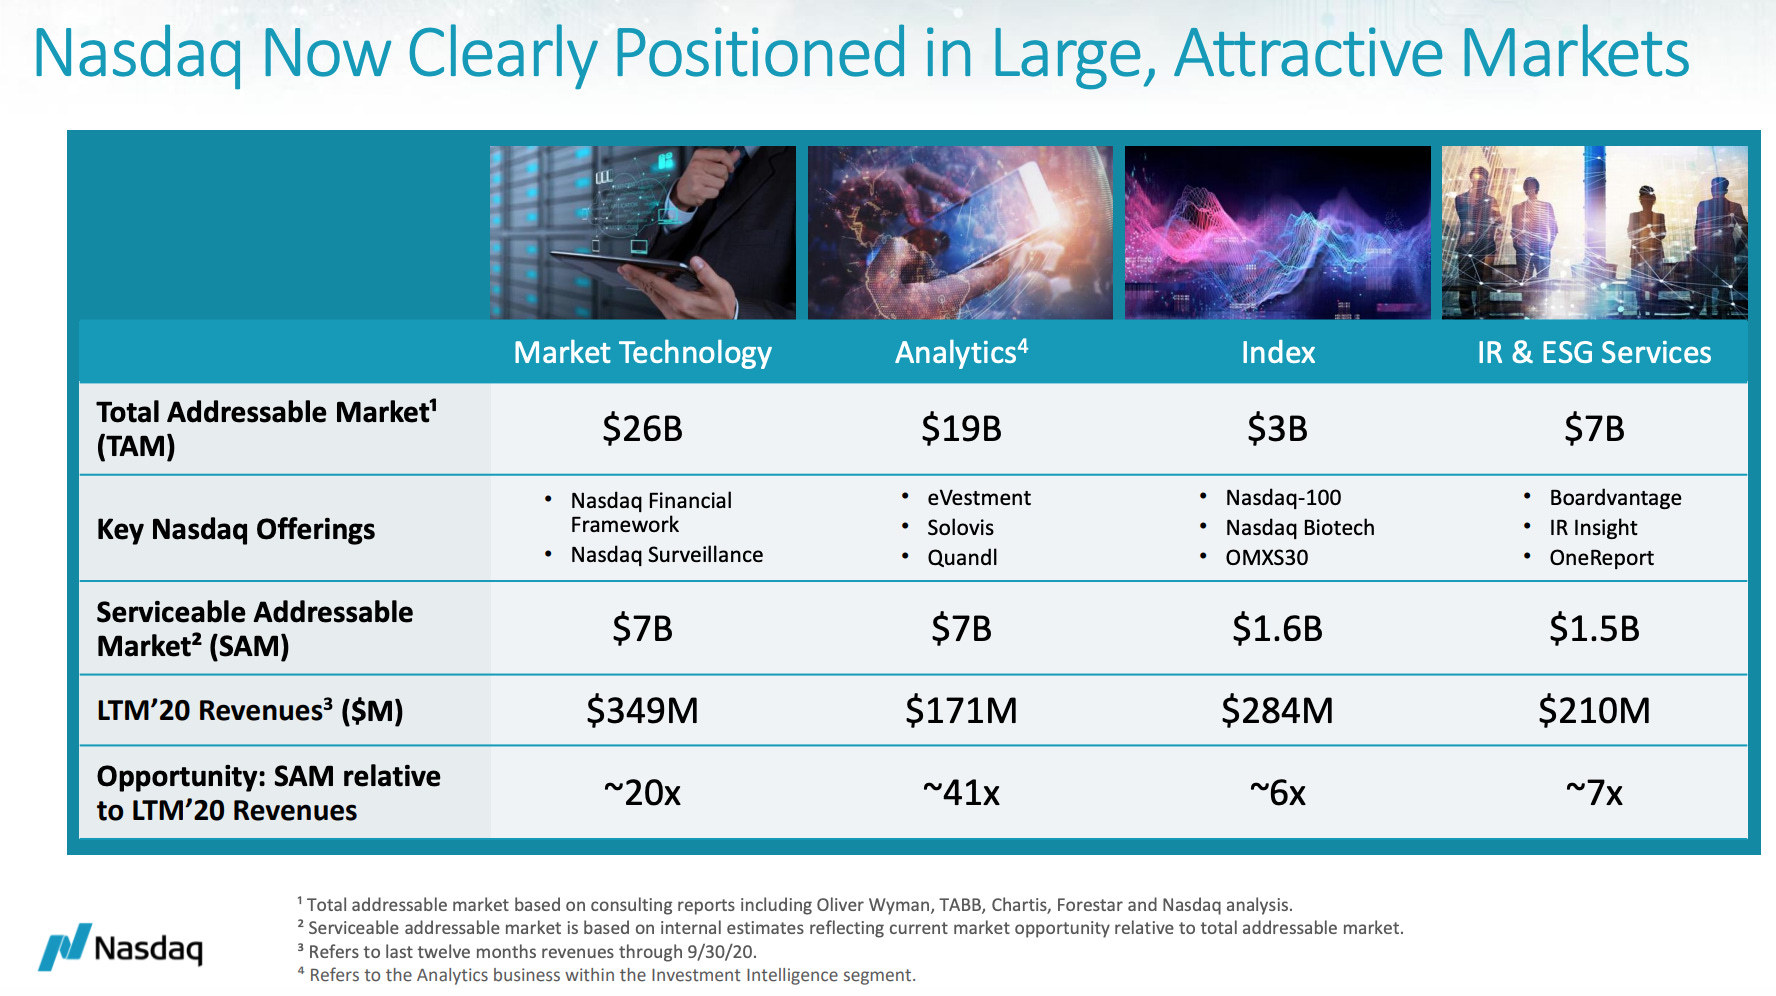
(Source)
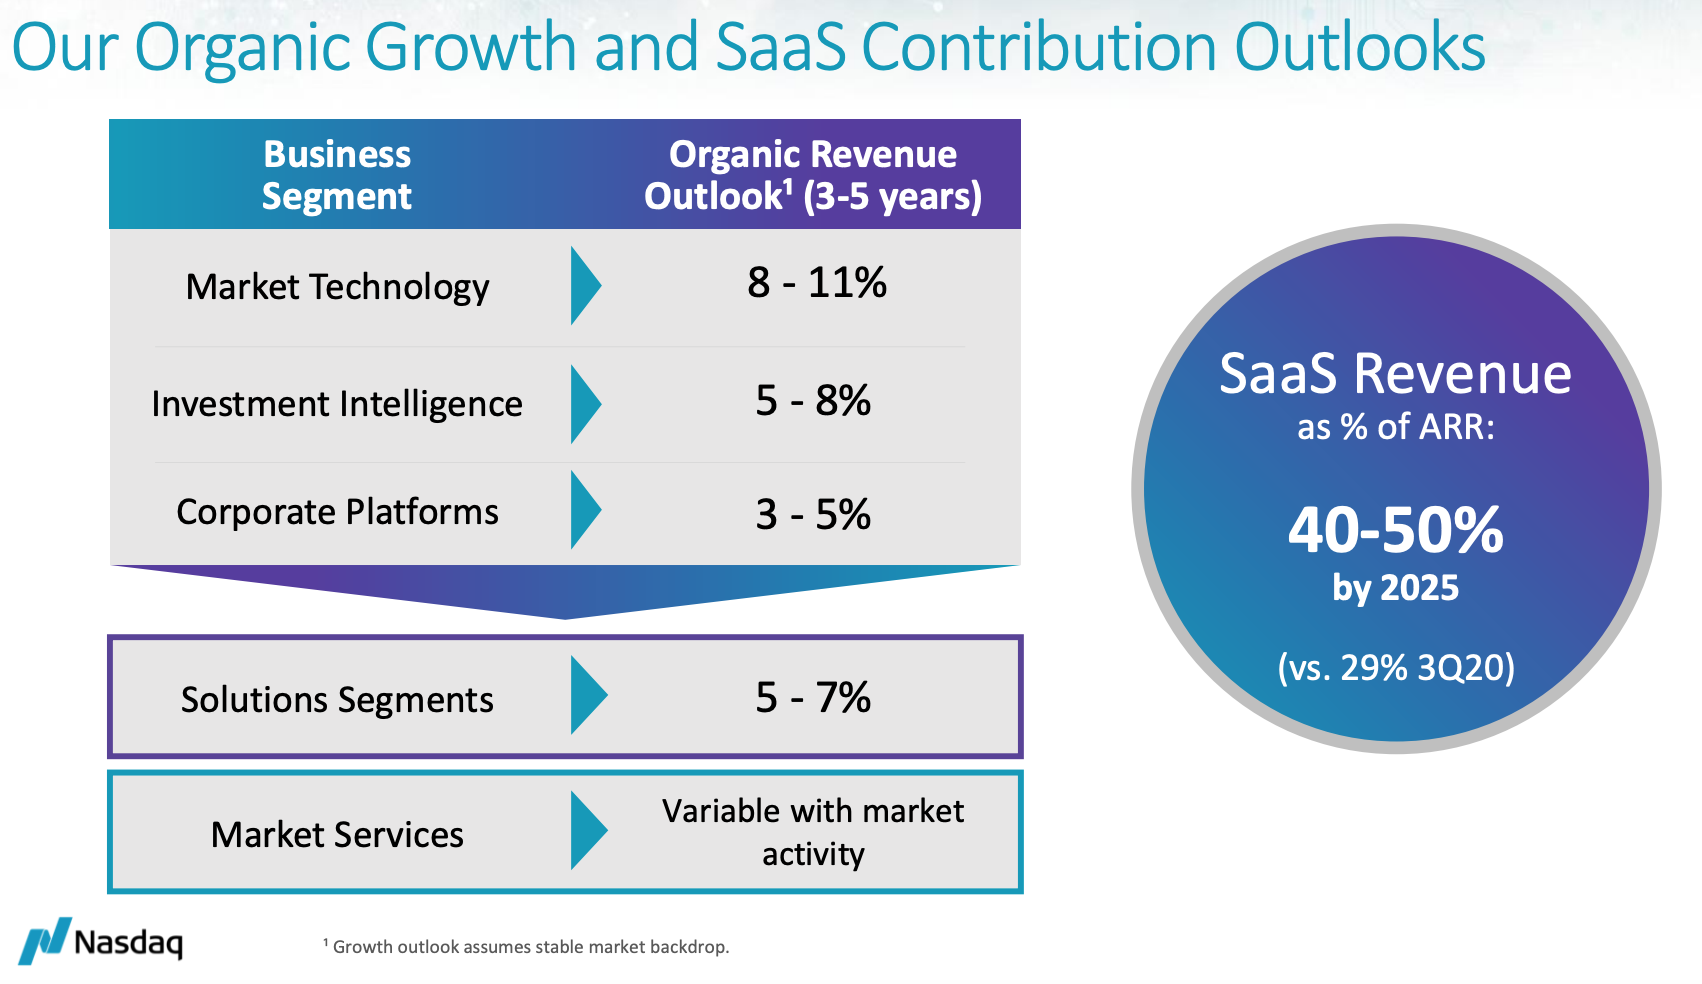
Nasdaq refreshed their medium-term financial outlook during the presentation - the company expects non-trading revenue to keep growing in the mid single digits driven by the transition to a SaaS model and new Market Technology products:
The targets given during Investor Day have so far been well received - Deutsche Bank analyst Brian Bedell upgraded Nasdaq to his top exchange pick after the conference.
CME - The CFO and head of financial products both spoke at the Bank of America Future of Financials conference this week. The most interesting comments came from a question the entire shareholder base is eager to know: when are interest rate volumes coming back? What are some signs investors can look for?
Management responded by comparing today’s recovery to the 2013 environment recovering from the ‘08 financial crisis. They used three metrics to back this up:
The US unemployment rate went from 10% in October 2009 to ~6.9% by the end of 2013, the same level of unemployment seen in October 2020 after peaking in April.
The Fed’s balance sheet expanded by ~$3 trillion between 2008 and 2013, which is the same amount of expansion seen between March & November of 2020.
The S&P 500 surpassed its pre-2008 peak in mid-2013, and surpassed its pre-COVID peak in August 2020.
It’s a thought provoking comparison, implying the Fed is done with balance sheet expansion and may turn its focus toward curtailing inflation in the months ahead, which historically has been a tremendous time for CME’s stock. Between 2013 and 2019, CME outperformed the S&P 500 by a wide margin as interest rate markets flourished:

CBOE - CEO Ed Tilly and CFO Brian Schell also stopped by the Bank Of America conference. Much of their conversation focused on their track record of bolt-on M&A, their vision for growth in Europe, and their strategy for fending off competition in the US equities market. A comment I found interesting came from Schell on maintaining equities market share - while they do want to maximize transaction revenue over the long term, keeping market data revenue associated with their equities business may take priority:
“…how do we help make the net revenue growth over the long-term more effective because we want a very strong share to help continue to, obviously, generate the SIP revenues.”
When an exchange loses an equities trade to a competitor, they lose more than just the transaction fee. Customers pay for data feeds to see these trades, and exchanges are allocated a portion of these fees based on market share. CBOE made ~$100 million in SIP market data revenue in 2019; if their equities market share drops, this figure drops in proportion.
Chart of the Week
It really is a thing of beauty to watch an asset class go electronic in real time. Today the corporate bond market is being attacked from multiple angles by the top two electronic platforms - MarketAxess and Tradeweb. A couple weeks ago I talked about how MarketAxess is using Open Trading technology to attract smaller sized bond trades onto the screen. Where Tradeweb has seen success to date is in the larger block trade sizes, using an innovative tool called portfolio trading. With a portfolio trade, participants can negotiate and execute one transaction for a basket of multiple bonds at a time, saving time & lowering costs.
Portfolio trading has seen steady growth since launching in early 2019, with record activity seen last month:

(Source)
Thank you for reading this issue of Front Month. Word of mouth is the #1 way others find this newsletter - If you liked this week’s content, please consider sharing with friends & colleagues. Questions & feedback can be sent via email or Twitter.
Disclaimer: I am not a financial advisor. Nothing on this site or in the Front Month newsletter should be considered investment advice. Any discussion about future results or projections may not pan out as expected. Do your own research & speak to a licensed professional before making any investment decisions. As of the publishing of this newsletter, I am long ICE, CME, CBOE, NDAQ and VIRT.