

A 2021 Exchange Industry Primer

Welcome to another issue of Front Month, a newsletter covering the biggest stories in exchanges every Friday. If you have questions or feedback, please reply to this email or find me on Twitter. If you like this newsletter and want to follow the exchange industry with me, please hit the Subscribe button below & be sure to share with friends & colleagues:
Happy New Year! Welcome to 2021.
Earlier this week I published a 2021 guide to the exchange & market data industry, breaking down the trends worth watching throughout the year along with an in-depth review of the 14 exchange & market data stocks that appear frequently in this newsletter. The guide focuses on each exchange’s “critical factor” - the one or two metrics that drive the majority of each stock’s performance. You can find this free guide on Gumroad below:
I’ve re-posted the first section of the guide below where I detail the four biggest themes affecting nearly every exchange & market data stock in 2021. These themes have been an important part of the industry in the past, but have grown in size & importance to each exchange’s P&L to the point where they’re worth hashing out in more detail.
Enjoy:
Trend #1 - ESG
The exchange & market data industry has rapidly embraced the ESG investing craze as regulators & consumers put more pressure on companies to diversify their boards, protect the environment and align interests with shareholders. Since the 2015 Paris Climate Accord demand for ESG-focused ETFs, analytics and related indices has grown exponentially.
ESG demand is expected to hit new highs in 2021 as more environmentally-focused millennials join the workforce and grow their financial assets, along with new products that give the buy-side better tools to manage ESG investments. For example, the analytics units of MSCI, S&P Global, Moodys, Nasdaq and ICE are working to standardize ESG data across public filings to give customers a dataset they can use to compare the ESG scores of companies and asset managers. We’re also seeing exchanges like CME and CBOE launch ESG futures products and MarketAxess support electronic trading of ESG bonds.
A recent report by Opimas predicted the market for ESG spend to reach $1 billion per year by the end of 2021, up from ~$600 million in 2019. Interestingly, the report cited ~60% of ESG demand from Europe today, with another 33% from the US and only 7% from Asia, giving me the impression the market still has a great deal of expansion left in developed and emerging markets.
MSCI and S&P Global are arguably the leaders in ESG today, with the most recognizable indices and ESG ratings units in their early stages of development.
Trend #2 - Passive Investing
Another output of an aging millennial population is the rapid & powerful rise of passive investing, with serious implications for markets & the exchange industry in particular. Bloomberg published an eye-opening chart showing how more money is now managed in passive equity funds than active ones, as older, more active-exposed generations sell out of the market and are replaced by younger, passive-exposed ones. This has two notable impacts – more power in the hands of index providers, and more market volatility. Both benefit the exchange & market data industry materially.
Why does a rise in passive investing affect volatility? When less money is in the hands of active market participants, the liquidity of that market drops. Goldman Sachs coined the term “passive-adjusted float” – how many free-floating shares of a stock are trading excluding those that are effectively locked by passive investors who don’t actively trade their retirement savings. Think of the new market as a giant but sleeping whale (passive money) with a few minnows that chase the whale’s coat-tails and live in its wake (active money). As passive investing grows and liquidity drops, volatility is bound to rise, and more volatility is generally correlated with more trading volumes & exchange transaction revenue.
The other impact of passive investing is the downstream power & influence bestowed on index providers. As more passive investors buy the S&P 500 ETF for example, more assets come under the influence of the S&P 500 index and more AUM fees flow to S&P Global in tandem. More headlines are also made when the S&P index committee makes changes to the underlying index, as a larger pool of investors are affected by their actions (ie 2020’s Tesla inclusion). S&P Global makes close to $1 billion per year from its index business, with high margins and a strong growth outlook moving into 2021.
S&P isn’t the only one with significant index exposure. Exchanges like ICE and Nasdaq have made acquisitions & investments in the space to build a portfolio of high-quality equity and fixed income indices, and European exchange LSE receives a whopping 50% of its revenue from indices via its FTSE-Russell business.
Trend #3 - Retail Participation
There is perhaps no market structure trend more talked about in 2020 than the retail takeover of the stock & options market. While many pointed to the impact of COVID lockdowns & stimulus checks as the drivers of higher retail participation, we forget that the industry as a whole moved to free trading only a short time ago in late 2019. With market friction at its lower bound there’s been nothing stopping novice investors from entering the market in droves, even with varying levels of economic recovery in the US and lower volatility towards the end of 2020. It looks like retail trading will be at permanently higher levels for the foreseeable future – in my view only a sustained equity market meltdown would reverse this trend.
Who benefits from the retail tidal wave? In short, everyone.The top 3 options exchanges – Nasdaq, CBOE and ICE – should continue to enjoy stellar industry volumes that have broken numerous records in 2020.Cash equity volumes should also stay stronger than historical averages, boosting the same three exchanges.More retail trading of ETFs in any size will have nominal benefits flow to BlackRock and the corresponding index providers. The biggest beneficiary I see from secularly higher retail trading however is Virtu Financial, the only publicly traded market maker in the US. 2020 has been a truly magnificent year for Virtu as they took advantage of COVID volatility & wider bid/ask spreads in the equities & fixed income space. management cites the same trends as reasons to be bullish in 2021.
Just as importantly, I believe the rise of retail has the potential to reward exchange stocks with higher multiples as the market accepts the new dynamic as a long-term phenomenon rather than a temporary pop bound for reversal.
Trend #4 - M&A
Exchanges have always been an acquisitive bunch given the industry’s high barriers to entry & capital needed to expand into new markets. 2020 has been a banner year for M&A across the globe – notable deals this year include ICE - Ellie Mae, S&P Global - IHS Markit and LSE– Refinitiv. While there are still a few companies out there that could do a deal in 2021, I think next year the industry will be more focused on integrating existing deals. Can acquirers get expected synergies the way they planned? How fast can they de-lever? Were these deals a good use of investor cash? I think management teams of most exchanges will be battling questions like this all year, playing more “defense” in terms of execution rather than “offense” associated with hunting for potential targets.
If a big exchange or market data deal were to happen, two firms stand out to me as the most likely to be involved – CBOE and FactSet. Both are small enough to be purchased (CBOE at a $10B market cap and FactSet at a $13B market cap), would benefit from diversification, and are two of the lesser-loved stocks in the space (average sell-side price targets are at or below each company’s year-end 2020 price).
I could also see Moody’s and MSCI make a deal happen & potentially combine given what their competitors are doing.The S&P-IHS deal creates the #1 ratings agency and the #1 index provider globally, leaving Moody’s and MSCI the #2 players in their respective industries.MSCI would also be able to pair their leading ESG ratings & analytics with Moody’s analytics platform and larger ratings business, creating meaningful synergies.
FactSet Earnings
FactSet runs on a fiscal calendar ending in August; they reported their Q4 earnings in September 2020 and revealed guidance for 2021, expecting full-year revenue growth of +6% and paltry EPS growth of +1%. The low EPS guide is notable as it compares to near-double digit growth for the past three years:
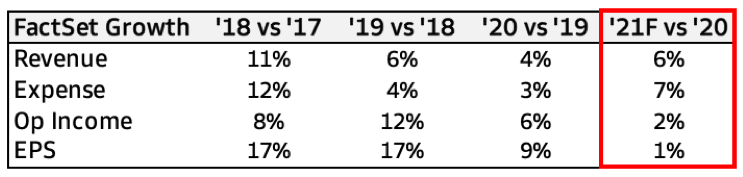
(Source - FactSet quarterly earnings reports)
Management explained guidance in the context of 1) uncertainty about delayed sales & implementations given the pandemic and global economic recovery, and 2) the desire to maintain a strong level of investment spending, hence the high expense guide. The stock has underperformed the S&P since Q4 earnings given the expectation for lower margins & anemic growth in fiscal 2021.
With this context in mind, FactSet reported their fiscal Q1 2021 earnings on December 21, posting revenue growth of +6% and - to the market’s surprise - EPS growth of +12%. Strong implementations of FactSet’s Analytics & CTS products helped the top-line while lower COVID-related employee costs improved margins. The all-important ASV growth metric - an indication of future demand & revenue potential - was a bit puzzling. An initial print of +5% was in-line with expectations, but management cited strength in their Research unit as the primary growth driver, with Wealth & Analytics a drag on sales growth. In the past, Research (FactSet’s largest segment) has been the consistent, slow growth business while Analytics, Wealth and CTS drive overall growth. This quarter, we saw a bit of the opposite occur.
Another puzzling piece of the earnings call was the fact that, in spite of a +12% EPS quarter amid a full-year 2021 guide of +1%, FactSet didn’t raise their guidance range. Analysts questioned this during Q&A - why not raise guidance if Q1 looked so good? Management held firm on an uncertain outlook for 2H 2021 - they don’t want to lock in a rosier outlook quite yet with too many variables still unclear, including how data spend with their biggest clients will come in.
Overall I agree with the decision to not bank on a better full-year outlook after one quarter, but the guidance range wasn’t exciting to begin with. Analysts are already expecting FactSet to beat the upper range of their EPS guidance ($11.18 consensus vs. FactSet’s range of $10.75 - $11.15) with Q1 as a tally in their favor. I believe FactSet will in fact raise their range later in the year, with the only question being how high will be enough to impress the Street and get their stock back on track?
FactSet’s earnings are an important bell-weather for the market data industry, as their outlook reflects buy & sell-side demand for analytics products in the US and Asia. A strong Q1 2021 for FactSet should translate to a good Q4 for competitors like S&P Global, MSCI and Moody’s. The difference in outlooks among the industry will be very interesting to watch as those on a normal fiscal calendar begin to reveal 2021 guidance in February.
Honorable Mentions
According to FINRA, investors racked up record levels of margin debt in November with $722 billion outstanding. For context, November’s figure is 10% higher than any month in 2020 and nearly triple the amount outstanding in 2011.
CBOE listed four active, semi-transparent ETFs from Invesco on December 22 in a bid to attract new customers & market share. Semi-transparent ETFs allow active fund managers to access the liquidity benefits of ETFs without having to disclose their portfolio holdings as frequently.
More Brexit transitions are set to take place at the start of 2021 after Britain and the EU agreed to a deal on December 24. As it relates to financial services, the EU is now requiring trading in EU equities to occur on an EU venue, which will move potentially large parts of the market out of London and to the Netherlands, Germany, and other European financial centers.
Chart of the Week
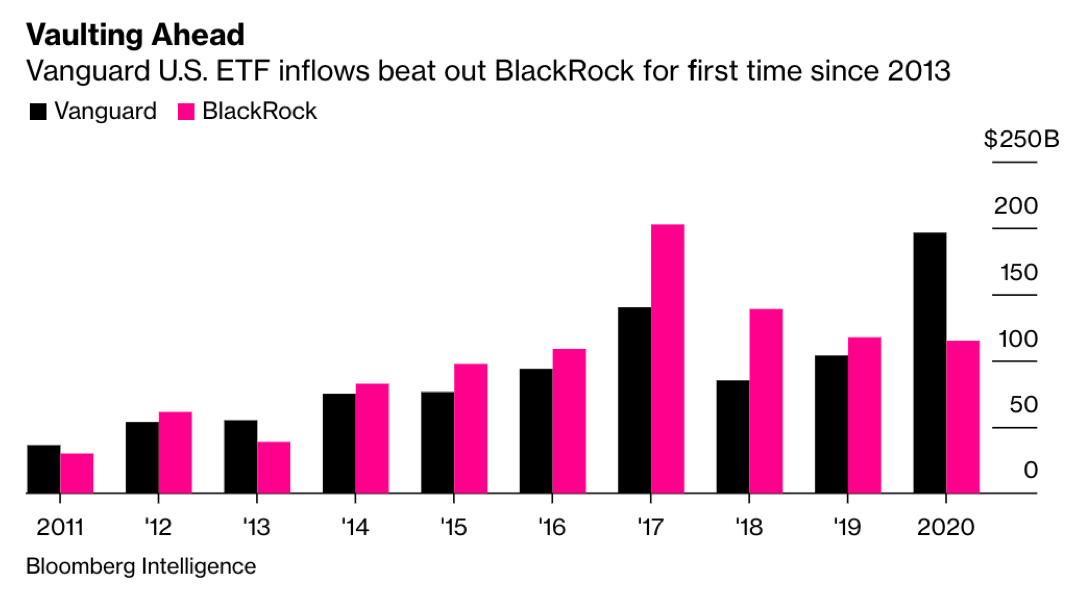
The passive ETF race is becoming more of a two player affair as final 2020 asset manager figures are tallied. A combination of lower fees & inclusion in easy to use “model portfolios” have pushed Vanguard & BlackRock farther ahead of State Street, Invesco and others in terms of AUM and inflows. This year Vanguard regained the #1 spot with record inflows of $194 billion, the first time they’ve been the leader since 2013. A driver of Vanguard’s success has been the growing ranks of buy-and-hold index investors who gravitate to their products over BlackRock and State Street, who boast better trading volumes despite lagging inflows:
Thank you for reading this issue of Front Month. Word of mouth is the #1 way others find this newsletter - If you liked this week’s content, please consider sharing with friends & colleagues. Questions & feedback can be sent via email or Twitter.
Disclaimer: I am not a financial advisor. Nothing on this site or in the Front Month newsletter should be considered investment advice. Any discussion about future results or projections may not pan out as expected. Do your own research & speak to a licensed professional before making any investment decisions. As of the publishing of this newsletter, I am long ICE, CME, CBOE, NDAQ and VIRT. I am also long Bitcoin.